Are you looking for the best places to live in Oxfordshire to focus your property search? From bustling market...

A move to the country
When you think of your dream house is it in the bustling metropolis, or the quiet countryside? Perhaps a town with all the conveniences but plenty of nature and wildlife around, with the countryside in easy reach?
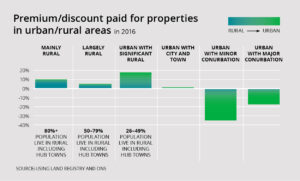
What about everyone else? What are we actually paying for? By classifying local authorities by their population living in rural or urban settings and analysing any shift in prices paid it is easy to see a dramatic difference in the housing market for the different settings.
Independent research carried out for Garrington, shows a distinct shift to the country during 2016. The graph clearly shows a slight premium paid for homes in mainly or largely rural areas. The biggest premium, of 18% comes in the best-of-both-worlds “urban with significant rural” category.
Then the two urban categories show a dramatic drop. Urban with minor conurbation shows discounts of 35% and urban with major conurbation over -15%, mirroring the top performing middle-ground “urban with significant rural.”
The data excludes London – which would skew the results – but it clearly shows a cooling off in the cities as the markets have over-heated with demand being driven up in rural areas as a result. It’s fascinating stuff and deserves further analysis and study. With more digging it should be possible to find patterns by types of property, region or various other factors.
The highest premiums go to…
“Urban with significant rural” commanding a premium over the national average is not a surprise to most of us, who can easily see the benefit. An 18% increase and the depth of discounts in other areas might be a bit more of a surprise. But these areas combine the convenience of an urban setting with the quality of life of countryside within easy reach and have 26-49% of the population living in rural settings.
Urban or rural local authorities
Only nine local authorities fall within the deeply discounted “urban with minor conurbation” category, with most, a total of 97, as “urban with city and town.”
The classifications are from Land Registry and Ordnance Survey data and available in official statistics information from the government. Looking at the maps it is easy to pick out major cities like London, Birmingham, Manchester, Liverpool and Newcastle.
Cornwall, Devon and the South West, East Anglia, Cumbria and swathes of the North show as mainly rural. It’s not a reflection of land use, but of where the population actually lives – in the countryside or in cities, or, more likely, hub towns.
It’s an interesting breakdown because it’s not simply geographical data but of the actual setting of the local authority areas and how that then combines across the country. So it offers a different perspective on the housing prices in the different categories of area.
Whatever kind of area you want to move to, call Garrington for advice.
